Housing
Housing
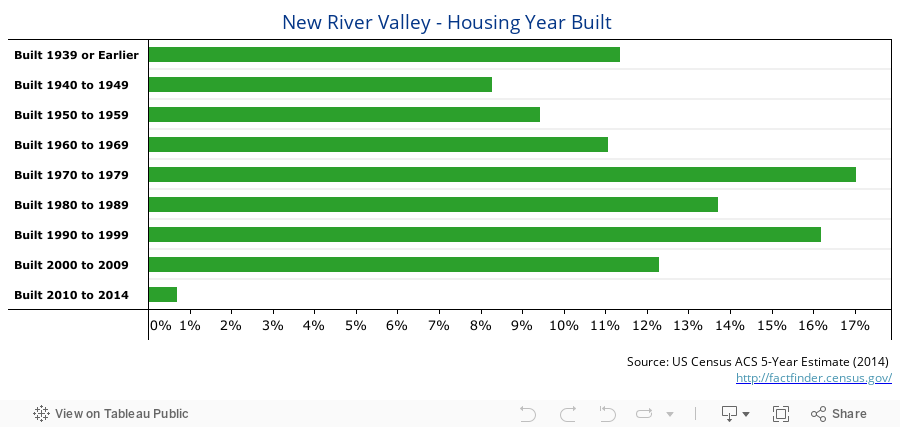
Housing Year Built – New River Valley
This dashboard shows the breakdown of when housing units were built in the New River Valley. Hover over the bars in the graph to view data and definitions.
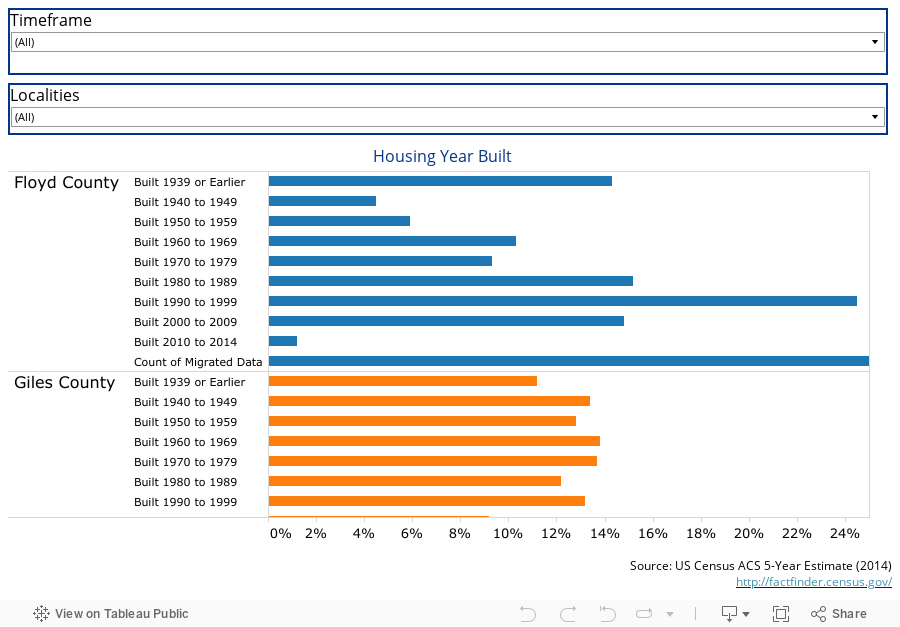
Housing Year Built – By Locality
This dashboard shows the same breakdown of when housing units were built, but by each locality in the New River Valley. Hover over the bars in the graph to view data and definitions. Use the “Timeframe” drop down menu at the top to select one or multiple timeframes to view. Use the “Localities” drop down menu below that to select one or multiple localities to view.
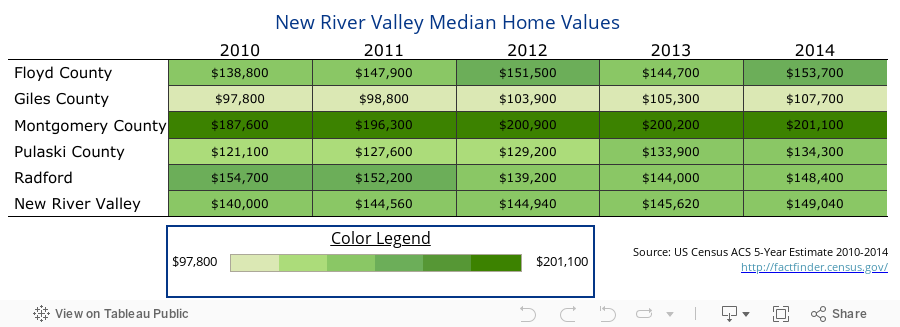
Median Home Value
This dashboard shows the Median Home Value in the counties and city within the New River Valley. Hover over the dashboard to view data.
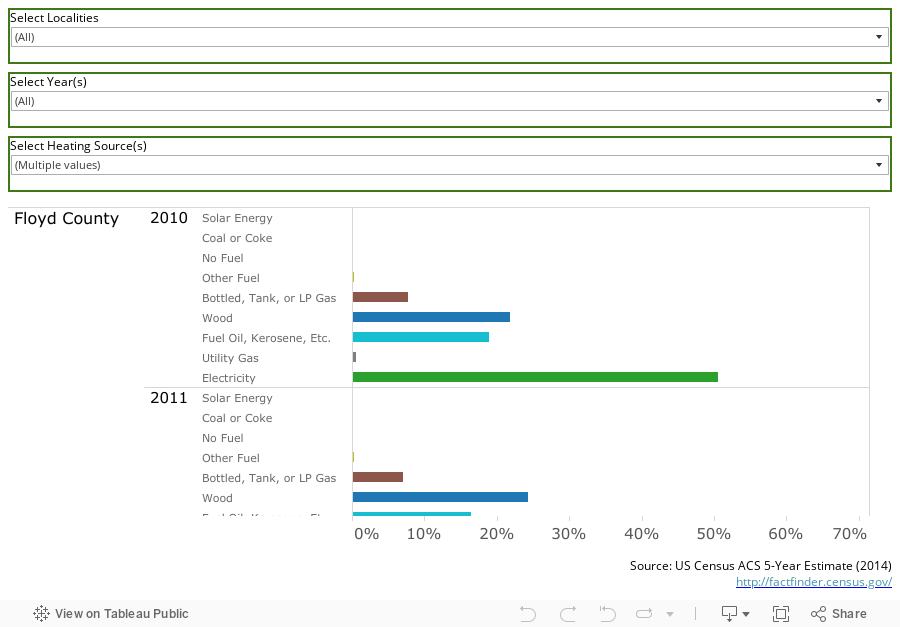
Occupied Housing Fuel Type
This dashboard shows the primary fuel source for occupied housing for each county and city in the New River Valley from 2010 to 2014. Hover over the bars in the graphs to view data and definitions. Use the “Select Localities” drop down menu at the top to select one or multiple localities to view. Use the “Select Year(s)” drop down menu to select one or multiple years to view. Use the “Select Heating Source(s)” to select one or multiple heating sources to view.
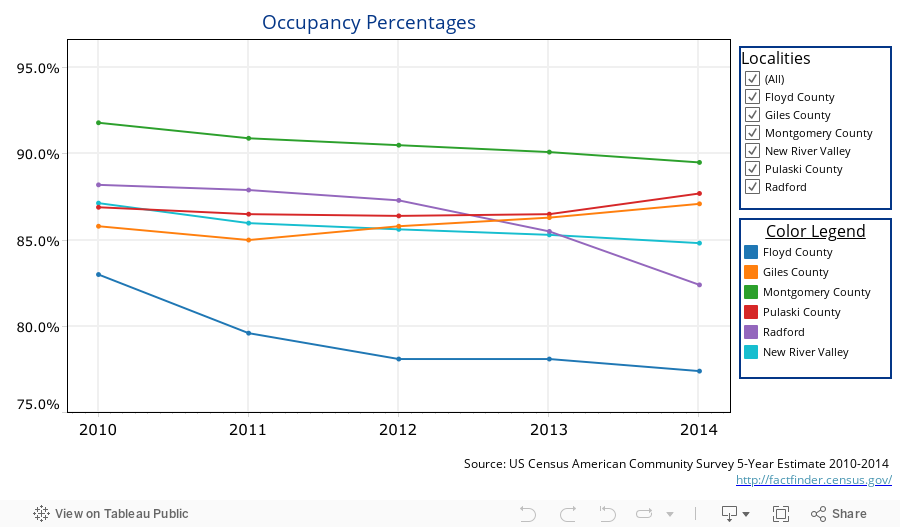
Occupied Housing Rate
This dashboard shows the Occupancy Percentages for each county and city in the New River Valley from 2010 to 2014. Hover over the lines in the graph to view the data. Use the “Localities” drop down menu to select one or multiple localities to view. Select a locality in the color legend beneath the graph to highlight it on the dashboard.
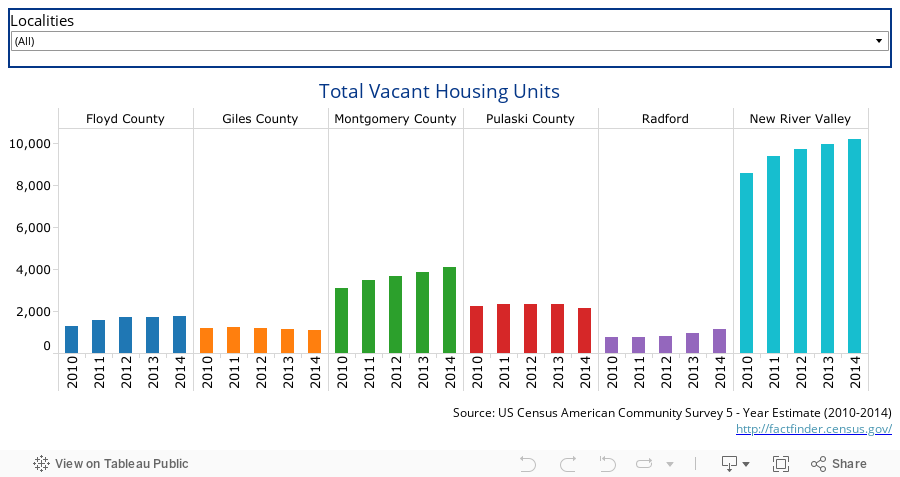
Vacant Housing Units
This dashboard shows the amount of vacant housing units, along with percentage of vacant housing units for each county and city in the New River Valley from 2010 to 2014. Hover over the bars in the graph to view data. Use the “Localities” drop down menu to select one or multiple localities to view.