Economic Indicators
Economic Indicators
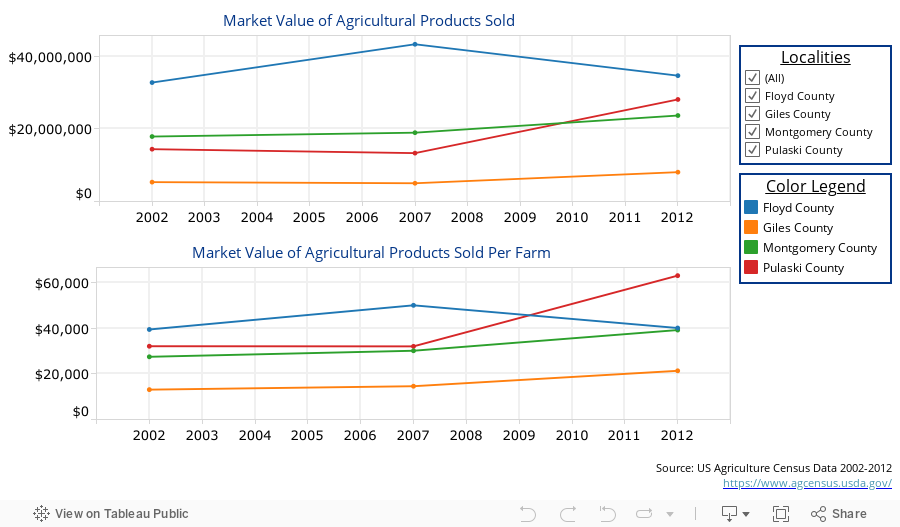
Agriculture Economic Data
Agriculture continues to be a major portion of the region’s economy. This dashboard shows the Market Value of Agricultural Products Sold in each locality and as an average per farm in each locality from 2002 to 2012. Hover over the lines in the graphs to view data points and definitions. Use the “Localities” drop down menu at the top of the dashboard to select one or multiple localities to view. Select a locality in the color legend below the drop down menu to highlight it on the dashboard.
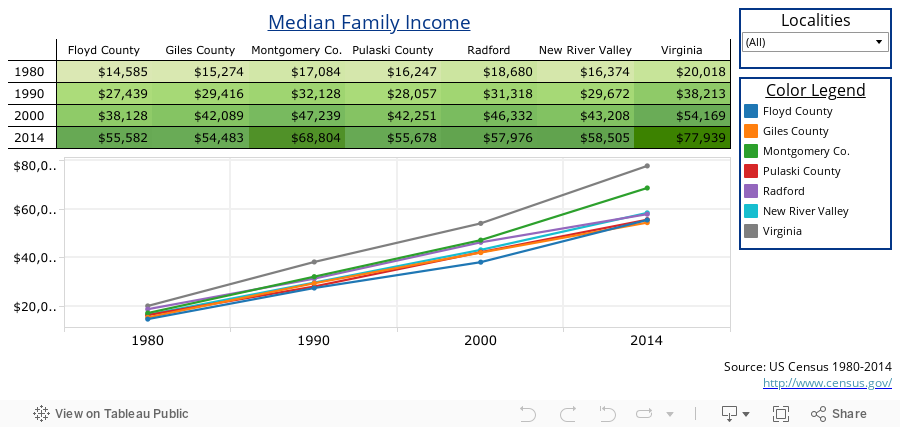
Median Family Income
Median family income is the measure typically used to assess community wealth and service needs. This dashboard shows the Median Family Income from 1980 to 2014 for each county and city in the New River Valley. It also allows you to view the New River Valley as a whole compared to Virginia. Hover over the graphs to view data. Use the “Localities” drop down menu on the right to select one of multiple localities to view. Select a locality in the “Color Legend” to highlight in on the dashboard.
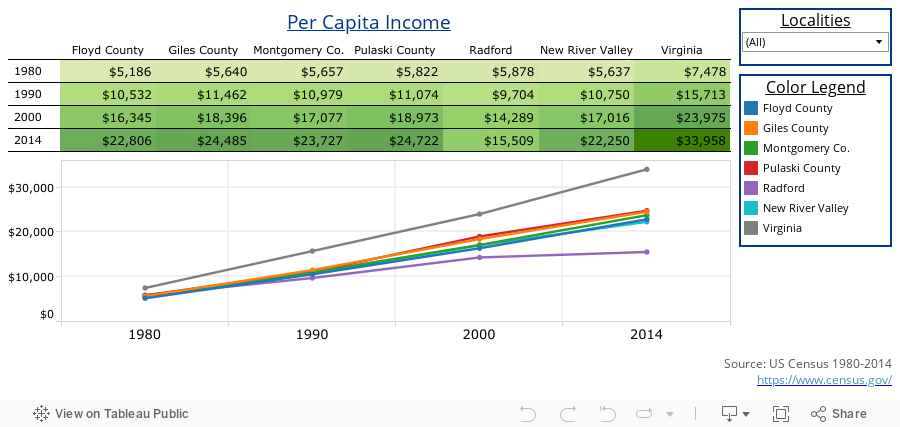
Per Capita Income
Per capita income is total personal income divided by population. This information gives a distributive spread of income across entire jurisdictions. This dashboard shows the Per Capita Income from 1980 to 2014 for each county and city in the New River Valley. It also allows you to view the New River Valley as a whole compared to Virginia. Hover over the graphs to view data. Use the “Localities” drop down menu on the right to select one or multiple localities to view. Select a locality in the “Color Legend” to highlight it on the dashboard.
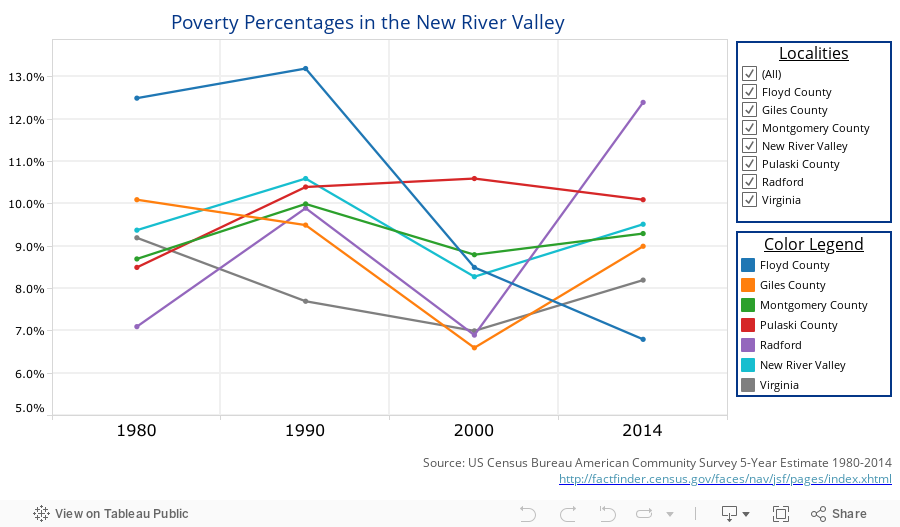
Poverty
Poverty status is determined for all persons except institutionalized persons, persons in military group quarters and in college dormitories, and unrelated individuals under 15 years old. This Poverty Dashboard allows you to see the percent of families below the poverty line along with the number of families below the poverty line within each county and city in the New River Valley from 1980 to 2014. Hover over the lines in the graph to view data points on definitions. Use the “Localities” drop down menu at the top of the graph to select one or multiple localities to view. Select a locality in the color legend, labeled with the localities and colored squares, beneath the graph to highlight it on the dashboard.
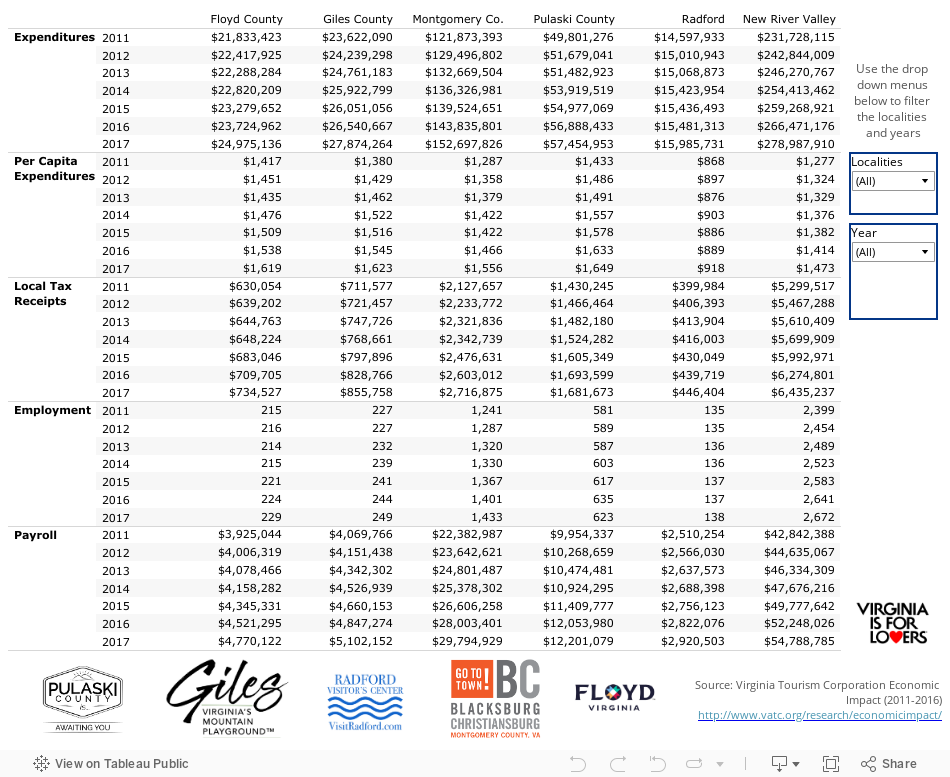
Tourism Economic Impact
Tourism has always been an important sector in Virginia's economy. Cultural attractions, historic landmarks, and recreational facilities, combined with good highway systems, have made the New River Valley a desirable destination for visitors. This dashboard shows multiple measures regarding the Tourism Industry in the New River Valley from 2011 to 2014. Hover over the dashboard to view data points. Use the “Localities” drop down menu on the left to select one or multiple localities to view. Use the “Year” drop down menu on the right to select one or multiple years to view.