Workforce
Workforce
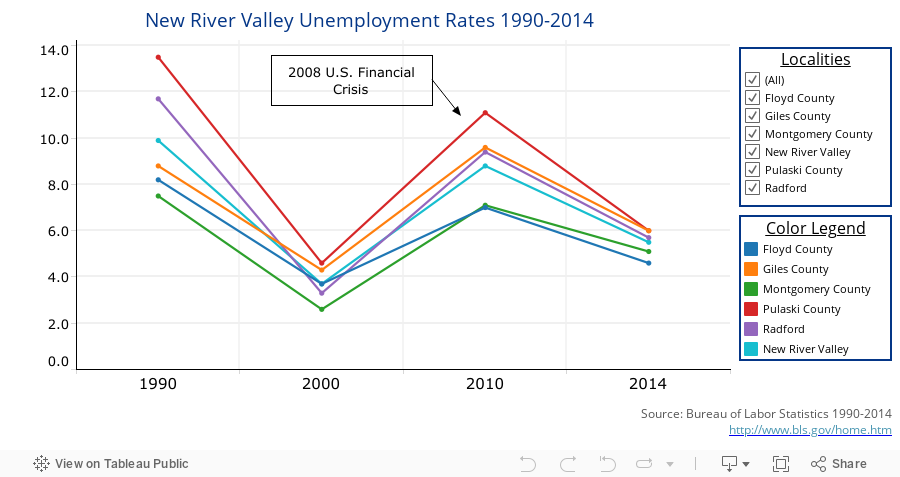
Unemployment
Unemployment rates are an important aspect of the New River Valley Workforce. This dashboard shows the Unemployment Rates in the counties and city within the New River Valley from 1990 to 2014. Also shown is the Unemployment Rate for the New River Valley as a whole. Hover over the lines in the graph to view data. Select a locality in the color legend, located below the graph, to highlight it on the dashboard.
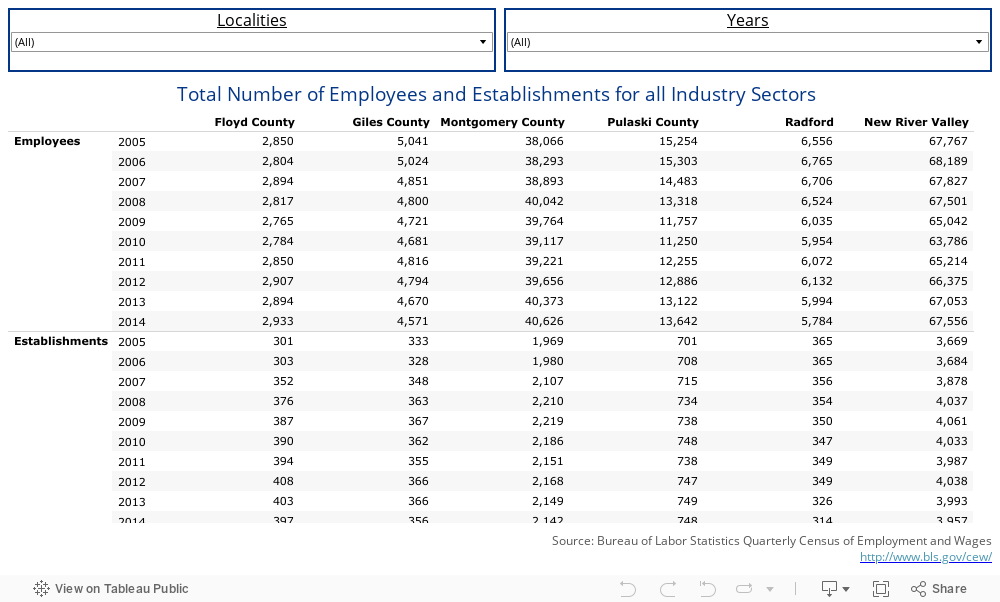
Total Jobs for All Industry Sectors
This dashboard shows the total number of employees and establishments for all industry sectors for each county and city in the New River Valley from 2005 to 2014. Hover over the data points in the dashboard to see data enlarged. Use the “Localities” drop down menu at the top to select one or multiple localities to view. Use the “Years” drop down menu to select one or multiple years to view.
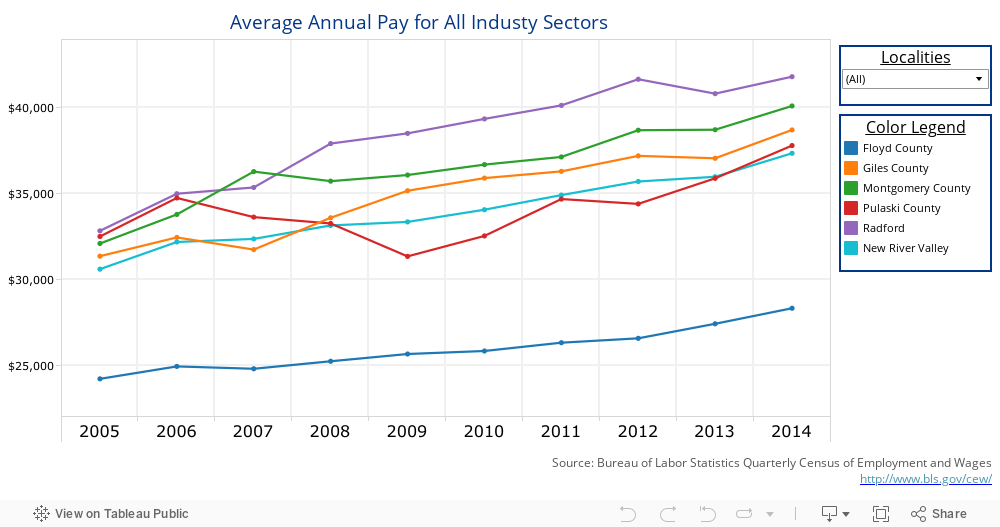
Average Annual Pay for All Industry Sectors
This dashboard shows the average annual pay for all industry sectors for each county and city in the New River Valley from 2005 to 2014. It also includes the New River Valley as a whole. Hover over the lines in the graph to view data. Use the “Localities” drop down menu at the top right to select one or multiple localities to view. Select a locality in the “Color Legend” on the right to highlight it on the dashboard.
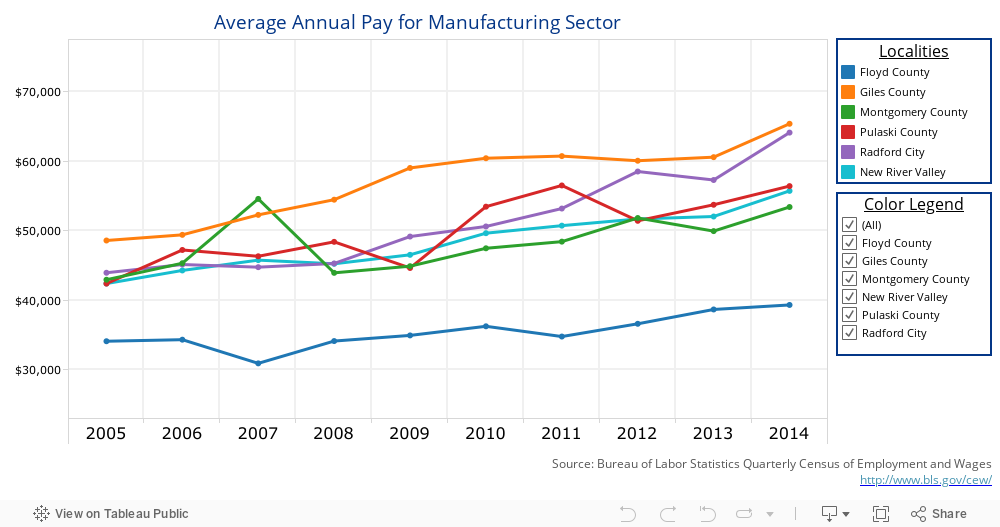
Average Annual Pay for Manufacturing Sector
This dashboard shows the average annual pay for employees in the Manufacturing sector for each county and city in the New River Valley from 2005 to 2014. This also includes the New River Valley as a whole. Hover over the lines in the graph to view data. Use the “Localities” drop down menu to select one or multiple localities to view. Select a locality in the “Color Legend” to highlight it on the dashboard.
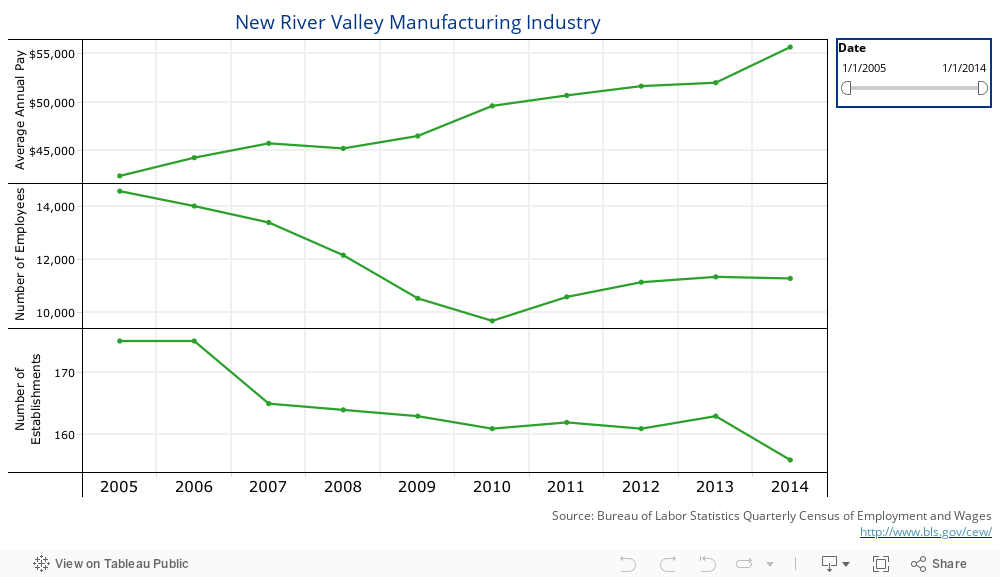
New River Valley Manufacturing Industry
This dashboard shows the average annual pay, number of employees and number of establishments for the Manufacturing sector in the New River Valley. Hover over the lines in the graphs to view data. Use the “Date” filter on the right to pinpoint a certain range of dates you may want to view.
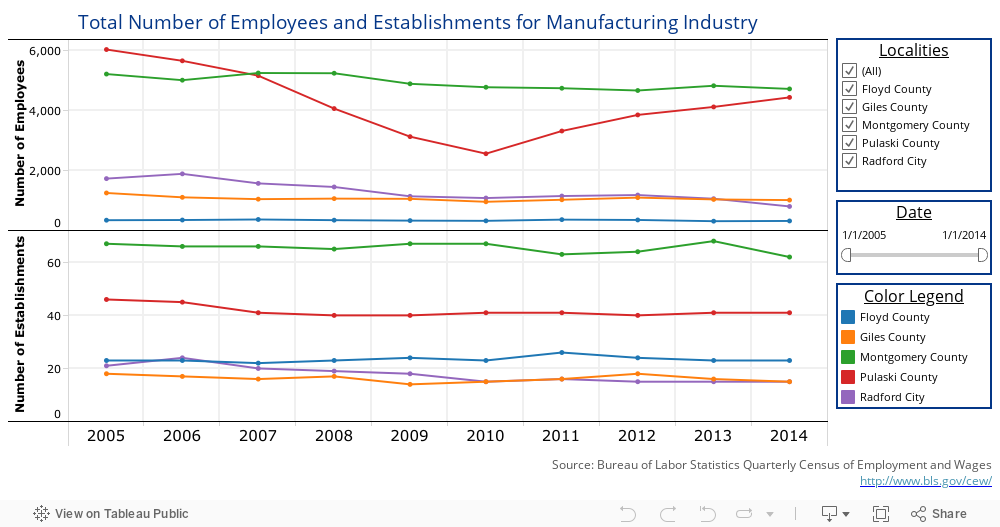
Manufacturing Industry by Locality
This dashboard shows the total number of employees and establishments in the Manufacturing Industry for each county and city in the New River Valley. Hover over the lines in the graphs to view data. Use the “Localities” drop down menu to select one or multiple localities to view. Use the “Date” filter to pinpoint a certain range of dates you may want to view. Select a locality in the “Color Legend” to highlight it on the dashboard.