Health
Health
Dashboards
Children in Poverty
This dashboard shows the percentage of children in poverty for each county and city in the New River Valley. This also shows the New River Valley as a whole compared to Virginia. The 2016 measure is based on Q1 reported data. The lines in the graph indicate trend lines. Hover over the lines to view data. Use the “Localities” list on the right to view an individual locality. Use the “Color Legend” on the right to highlight a locality on the dashboard.

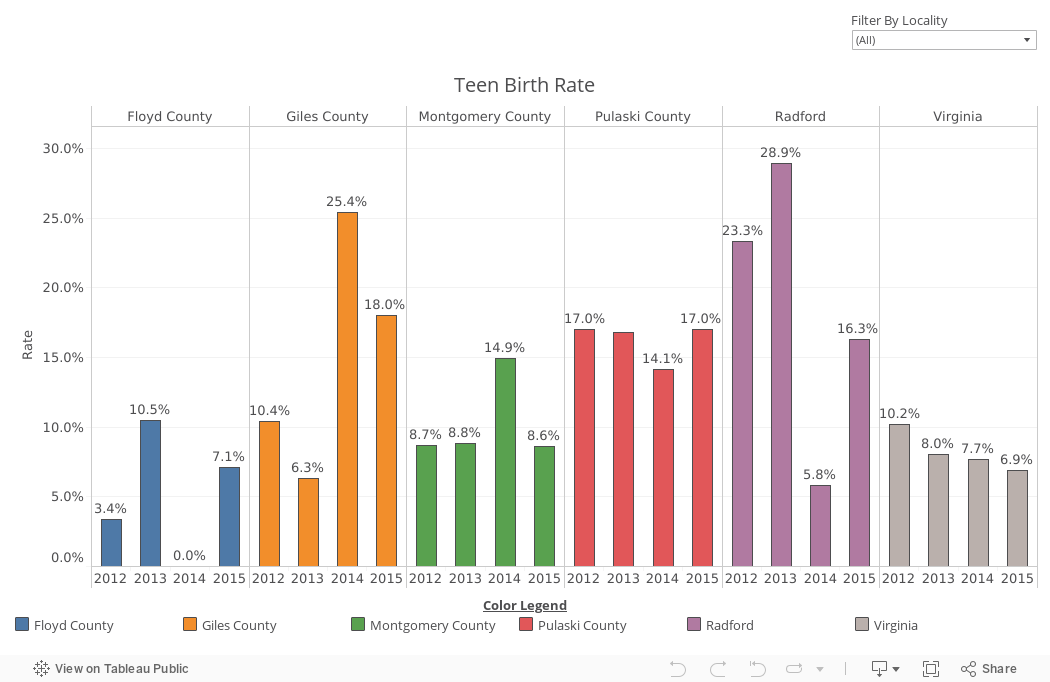
Teen Birth Rate
This dashboard shows the Teen Birth Rate per 1,000 teens for each county and city in the New River Valley from 2011 to 2016. It also shows the New River Valley as a whole compared to Virginia. The 2016 measure is based on Q1 reported data. Hover over the lines in the graph to view data. Use the “Localities” list on the right to select one or multiple localities to view. Use the “Color Legend” on the right to highlight a locality on the dashboard.
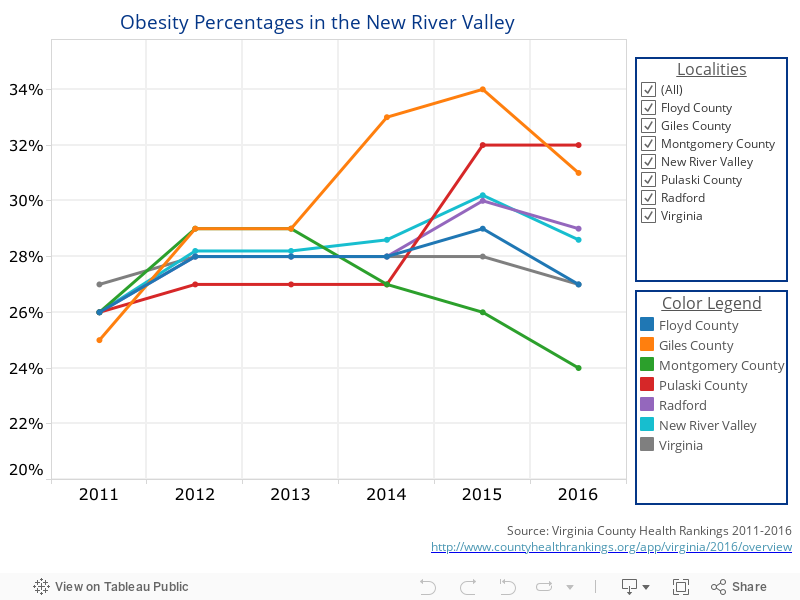
Obesity
Obesity is a key aspect in regards to health in the New River Valley. This dashboard shows the adult obesity percentages for each county and city in the New River Valley from 2011 to 2016. It also shows the percentage for the New River Valley as a whole compared to Virginia. The 2016 measure is based on Q1 reported data. Hover over the lines in the graph to view data and definitions. Use the” Localities” list on the right to select one or multiple localities to view. Use the “Color Legend” on the right to highlight a locality in the dashboard.