Transportation
Transportation
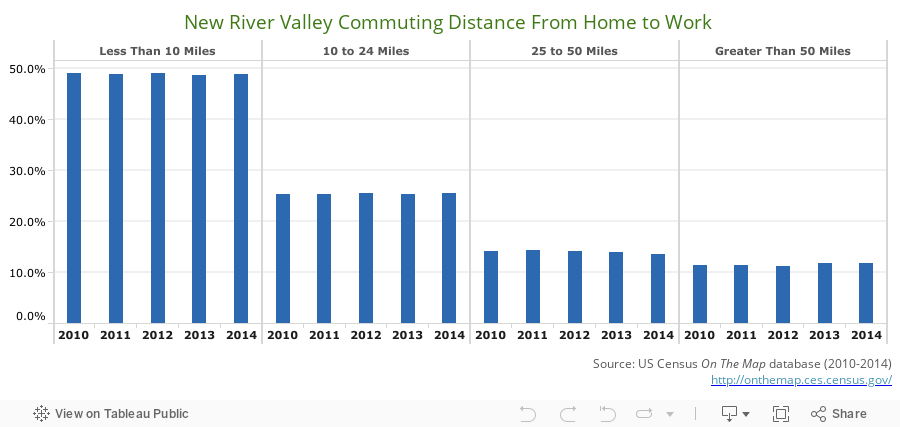
Commuting Distances from Home to Work
This dashboard shows the commuting distances from home to work in the New River Valley from 2010 to 2014. Hover over the bars in the graph to view data.
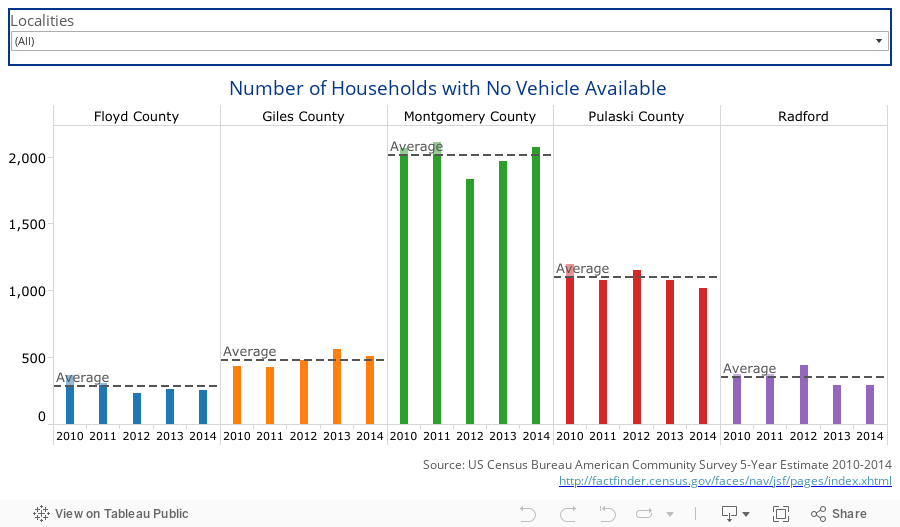
Number of Households with No Vehicle Available
This dashboard shows the number of households who do not have access to a vehicle. Each county and city in the New River Valley is displayed in this dashboard. Hover over the bars in the graph to view data. The lines indicating “Average” for each locality details an average number of households with no vehicle available in that five-year increment. Use the “Localities” drop down menu at the top of the dashboard the select one or multiple localities to view.
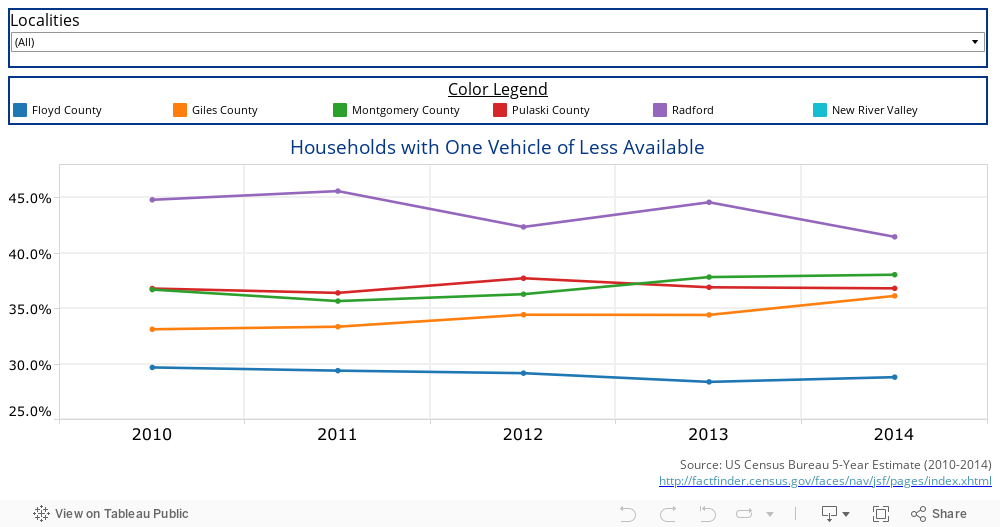
Number of Households with One Vehicle or Less Available
This dashboard shows the number of households with one or less vehicle available for each county and city in the New River Valley from 2010 to 2014. Hover over the lines in the graph to view more data. Use the “Localities” drop down menu at the top to select one or multiple localities to view. Use the “Color Legend” to select a locality to highlight it on the dashboard.