Population
Population
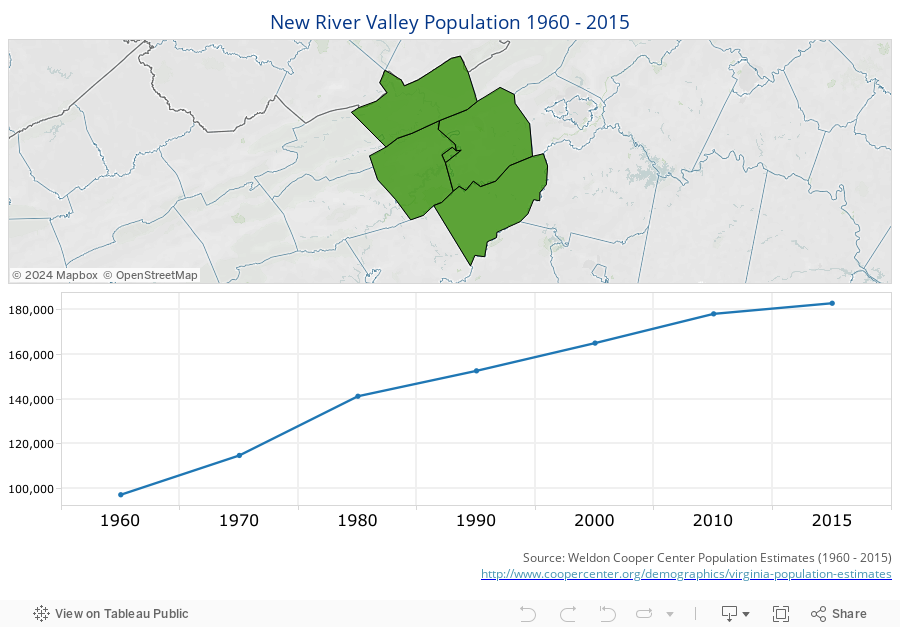
New River Valley Map & Population
This dashboard shows a map of the counties and cities within the New River Valley along with population statistics from 1960 to 2015. Hover over the counties in the map to view their names. Hover over the line in the graph to view data.
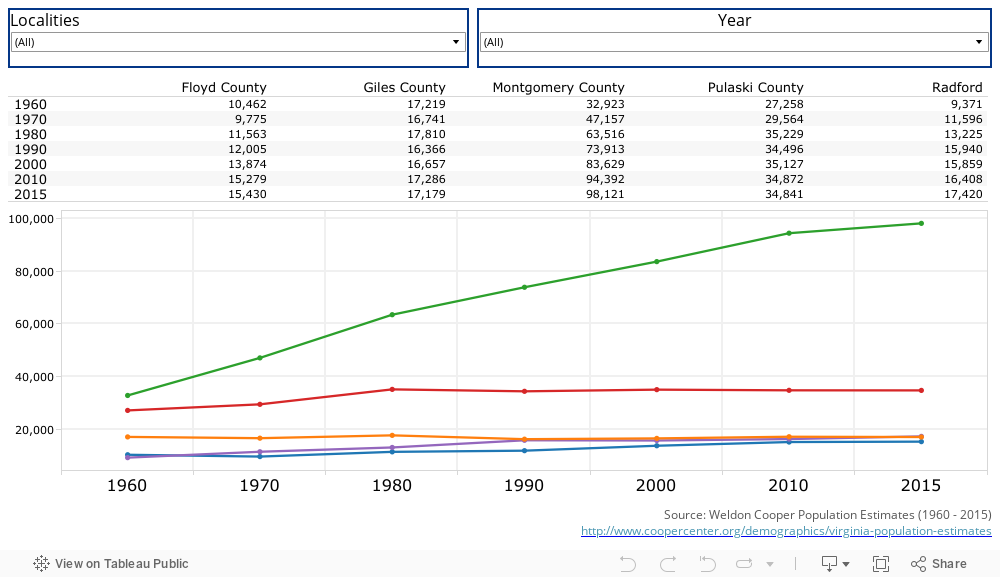
New River Valley Population by Locality
This dashboard shows the population for each county and city in the New River Valley from 1960 to 2014. Hover over the lines in the graph to view data. Hover over the data points in the text box at the top of the dashboard to make data enlarge. Use the “Localities” drop down menu to select one or multiple localities to view. Use the “Year” drop down menu at the top right to select one or multiple years to view. Clicking a locality in the text box and clicking a line in the graph will highlight it on the dashboard.