
Did you know that the total population of the New River Valley region is projected to increase by roughly 10% in the next two decades? That’s almost twenty thousand more people living, working, and enjoying the many opportunities offered in the NRV! The New River Valley Regional Commission makes this kind of data available on the Data Dashboard.
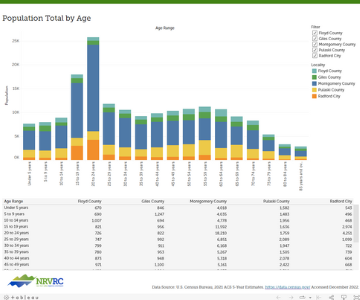
The New River Valley Data Dashboard is a collection of interactive data visualizations that features regional data topics including demographic, economic, housing, workforce, transportation, and health data. These interactive data visualizations are designed to be user-friendly for local governments, grant writers, non-profit organizations, and New River Valley citizens. Hover over a data point on a graph for more information, use filters to narrow down the localities included in the visualization, or refer to data tables at the bottom of each visualization to learn more about the region. Visit the Data Dashboard at nrvrc.org/data.
The Data Dashboard is currently updated annually as popular data sources, such as the U.S. Census Bureau, publish their official data sets. The most recent data from 2021 is currently being added. Have questions about available data or suggestions for the dashboard? For more information contact Bethany Peters at bethany@nrvrc.org.